The SATSAGEN RX/TX correction tables also called compensation/linearization tables are used to fix some lack of the supported devices, mainly for:
- Absence of an automatic leveling control ALC
- Poor linearity of the LNA, mixer, and other RF components
The goal is to obtain the device output power as the user set within +/- 1dB of tolerance in the whole device frequency range, and the same reliable levels displayed to the Spectrum Analyzer scope.
The tables are text files in INI format located in the Documents/satsagen/settings directory and loaded in memory at the application power on.
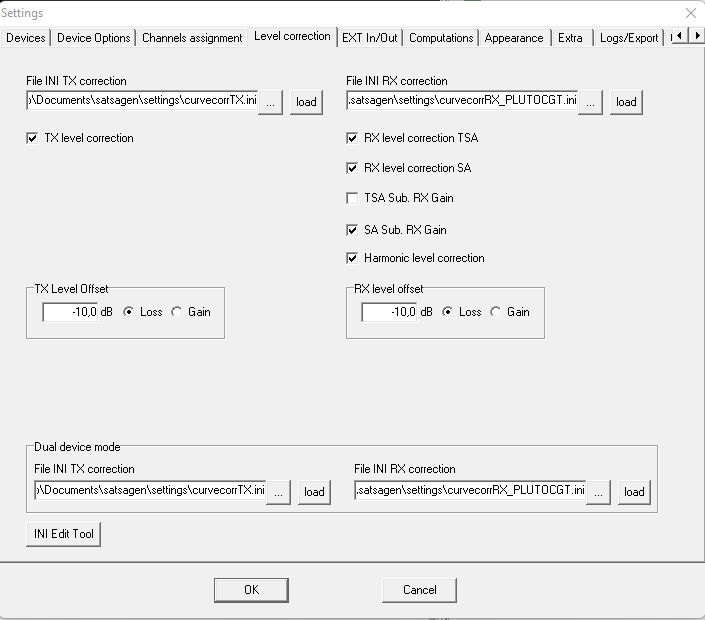
The complete pathname of the tables is specified in the Level correction tab under Settings:
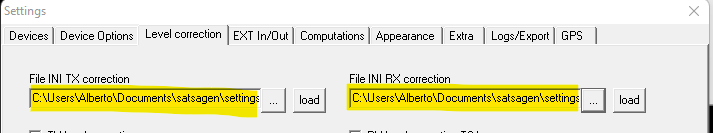
The tables can be enabled/disabled from the same tab with the following checkboxes:
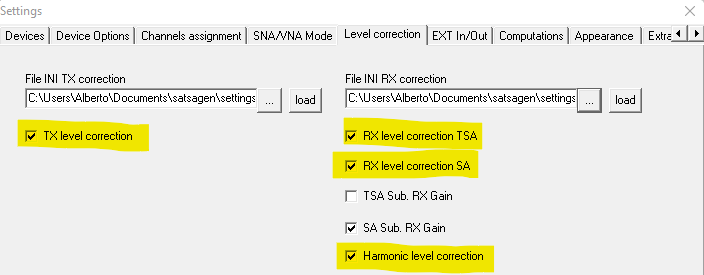
The TX level correction check enables the output leveling for the Generator, Sweeper, and Spectrum Analyzer with Tracking (TSA).
The RX level correction TSA check enables the read level compensation for the Spectrum Analyzer with tracking.
The RX level correction SA check enables the read level compensation for the Spectrum Analyzer only.
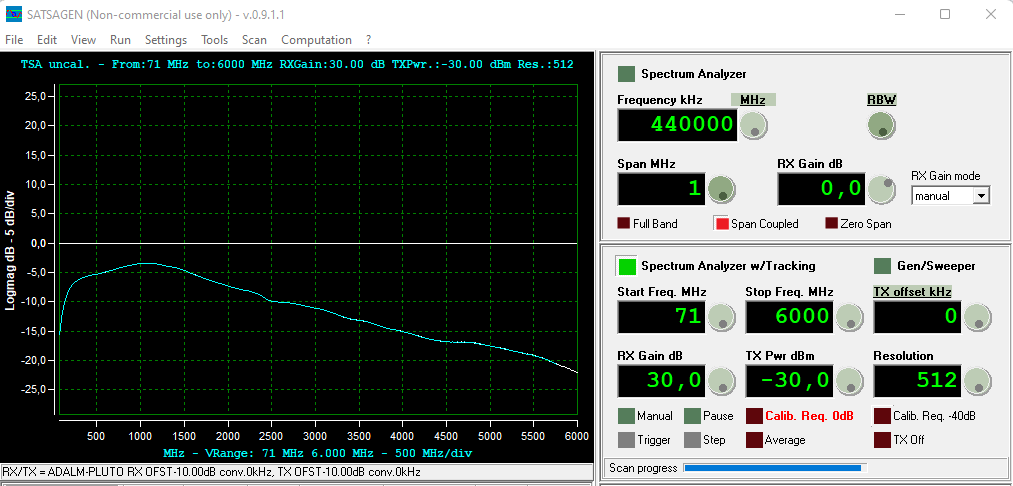
The following two examples are made using an ADALM-PLUTO with a loopback cable running a TSA scan for the whole range frequency with the correction tables enabled and not:
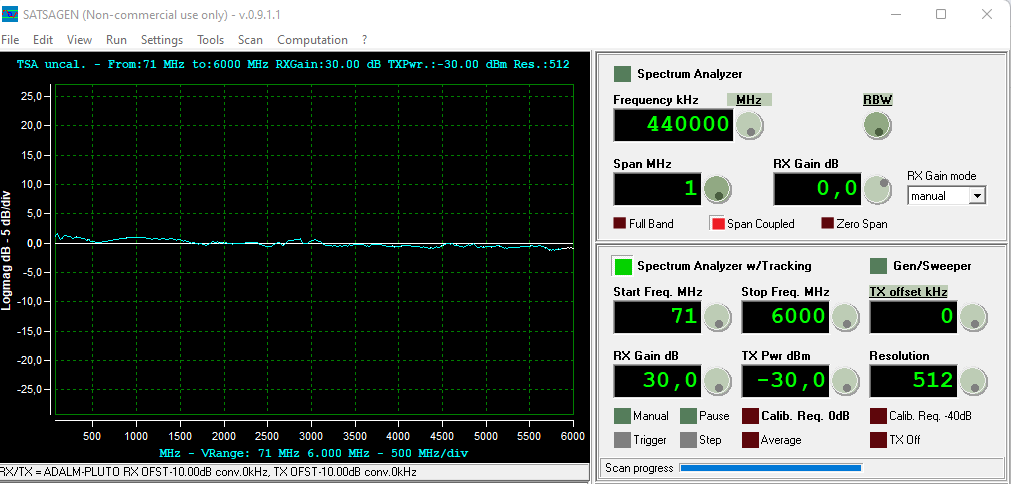
The tables are precompiled and deployed with the Satsagen setup with all the supported device characterization made using some device samples. However, customization may be necessary, we’ll see how to do this later.
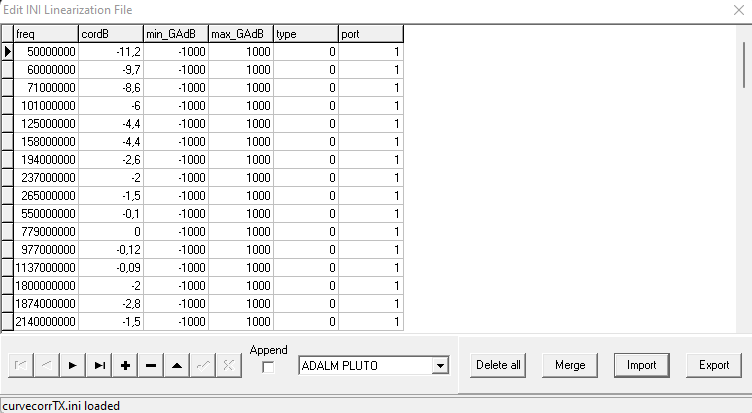
The standard TX linearization table file name distributed with the SATSAGEN setup is curvecorrTX.ini.
In a simplified way, the TX linearization table contains a list of entries Hz=dB for each supported device where the Hz is the frequency and dB is the variation compared to the corrected expected power at that frequency: a minus dB value corresponds to a final increment of TX power. Other fields are available, we’ll see them later.
The TX linearization table acts on the TX device attenuator, by correcting with increments or decrements the output power.
The RX compensation table acts on levels read from the device by correcting it passively instead, so for example, if the device reads -40 dBm and should be -30 dBm, the RX compensation table increments of -10 dB to display the corrected value of -30 dBm on the spectrum.
The standard RX compensation table file name distributed with the SATSAGEN setup is curvecorrRX_PLUTOCGT.ini.
In both RX/TX tables cases, an interpolation occurs if the test frequency is between two table entries.
The INI Edit Tool
It is possible to edit the correction tables’ INI files with an editor like Notepad for customizing purposes, but it is a hell.
Another way, but only a bit more user-friendly, is using the INI Edit Tool included in Satsagen.
Always make a backup copy of your INI files before using the INI Edit tool.
To use the tool, open it from the Level correction tab under Settings by clicking the INI Edit Tool button.
It is useful to leave the INI Edit Tool open, closing the Settings window only, to use it during the Spectrum Analyzer operations.
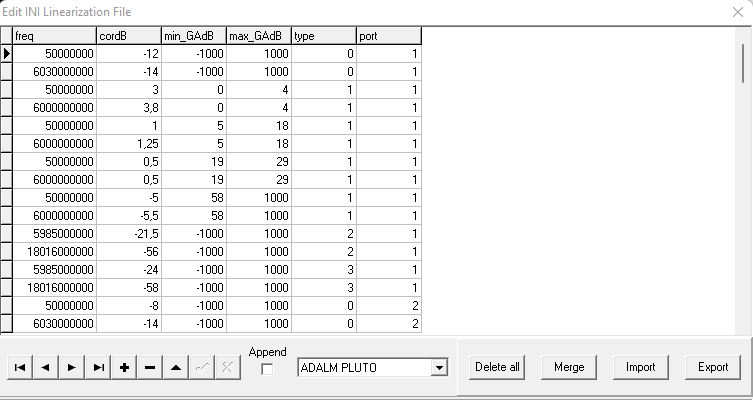
This tool is like a database table editor. The tool window comprises an editable grid at the top, a navigator bar at the bottom, a list containing the devices supported, and some function buttons.
The table starts empty and the device table selected corresponds to the first device supported, the ADALM-PLUTO.
You can start by editing a new table, selecting other devices, or importing an existing one with the Import button.
You can save to INI files with the Export button. All functions are related only to the selected device, e.g., if you made an export, only that table will be modified on the destination INI file specified.
When you export to the active configured INI file, this is automatically reloaded, and the changes become running.
Follow an example of using the INI Edit Tool to modify an entry of the RX correction table and view the result live (Prerequisite: a configured ADALM-PLUTO USB or Ethernet connected with a loopback cable.):
- Make a backup copy of the curvecorrRX_PLUTOCGT.ini file in documents\satsagen\settings
- Go to Settings, Level correction tab, and open the INI Edit Tool
- Close the Settings window leaving the INI Edit Tool window open
- Import the curvecorrRX_PLUTOCGT.ini file from the documents\satsagen\settings directory with the INI Edit Tool
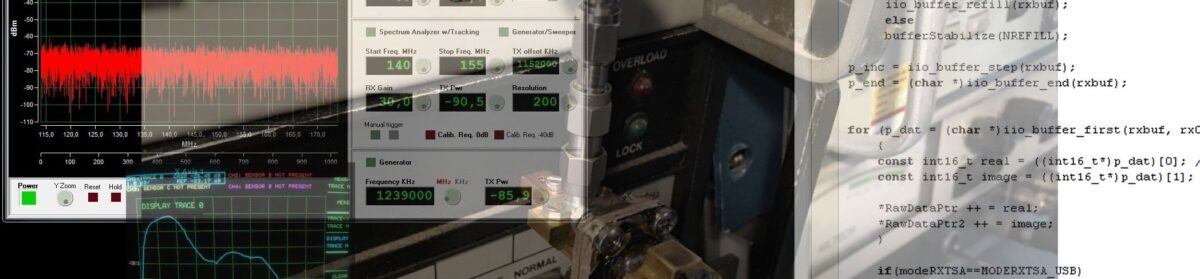
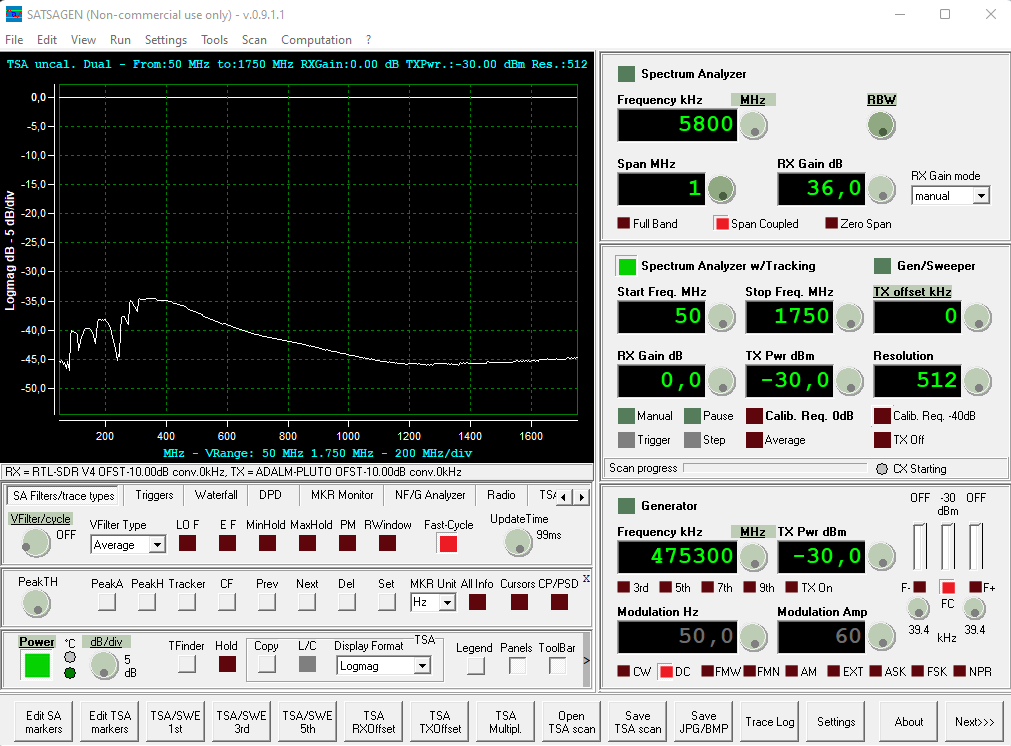
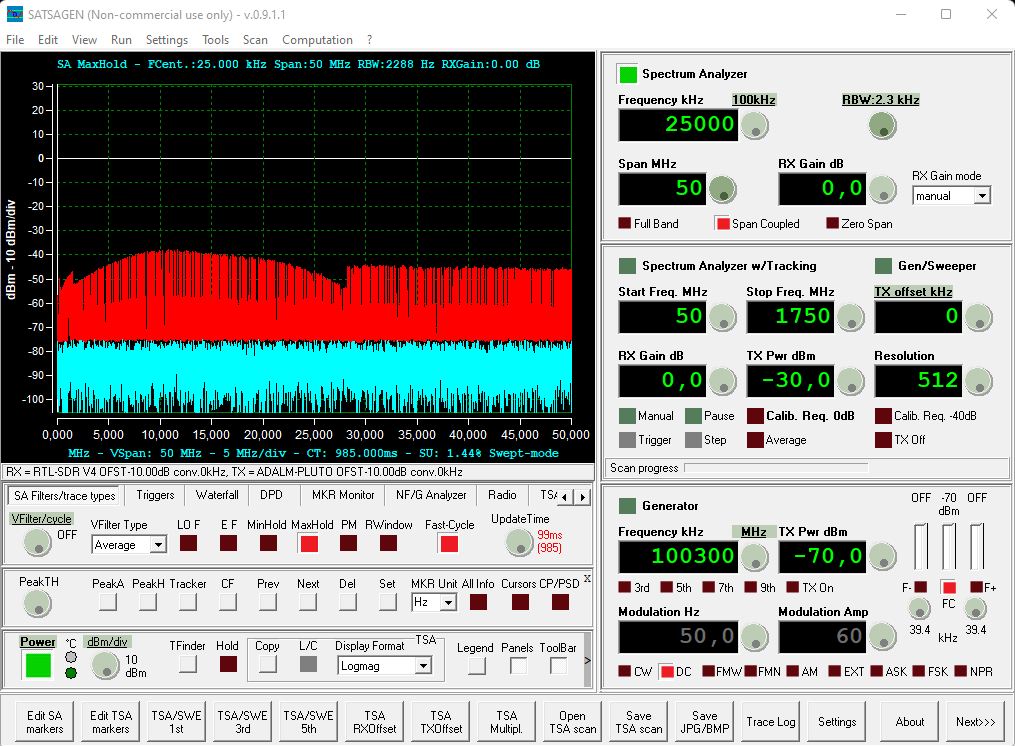
- Setup and run a TSA scan as shown in the following screenshot
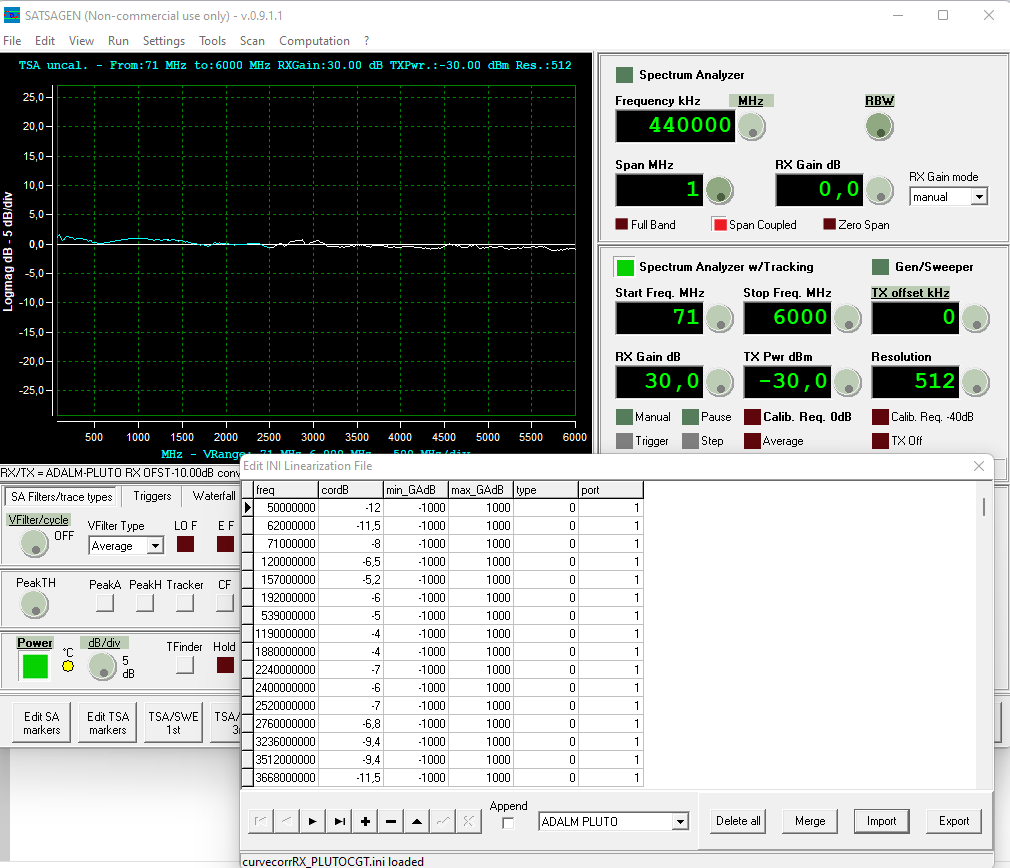
- Modify an entry, like the 1190 MHz from -4 dB to -10 dB
- Confirm the modification with the Post button from the navigator toolbar
- Export to the curvecorrRX_PLUTOCGT.ini file confirming the overwrite
- It should be visible on the display the modification applied:

- Restore the entry with the original value of -4 dB and export to the curvecorrRX_PLUTOCGT.ini file again
Deep on the RX/TX correction table fields
The RX correction table fields
Freq: frequency in Hz
cordB: dB correction as explained above
min_GAdB and max_GAdB: specify the RX Gain range scope
type: 0 for fundamental frequency correction entries
1 for fundamental frequency additional correction *
2 for third harmonic frequency correction entries
3 for fifth harmonic frequency correction entries
12 for third harmonic frequency additional correction
13 for fifth harmonic frequency additional correction
port: 0 for all the entries, except for devices that have multiple channels, like Pluto rev C/D, in this case, 0 means all ports, 1 only for the first channel ports, and 2 only for the second channel ports
With the min_GAdB and max_GAdB fields, it is possible to specify an RX Gain range where the Hz and CordB fields act. These fields are useful for characterizing specific non-linearity device behaviors linked to RX gain ranges.
The 1, 12, and 13 types are additional correction entries, useful to specify specific characterization within frequency ranges of the 0, 2, and 3 types of entries.
*Type 1 entries have a special feature: the Hz field of type 1 entries does not refer to the frequency of the spectrum but to the frequency of the receiver LO. They can therefore be used to describe additional corrections depending on the frequency of the local oscillator. This corresponds for example to the center frequency set when using the Spectrum Analyzer.
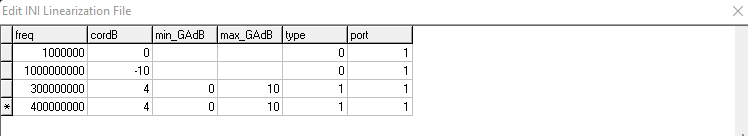
The following simple example of the RX compensation table describes a linear compensation that starts from 1 MHz to 1 GHz with a 10 dB ending correction. The two entries of type 1 describe an additional correction of +4 dB within the 300 MHz to 400 MHz range for the 0 to 10 RX gain db range only.
The TX correction table fields
Freq: frequency in Hz
cordB: dB correction as explained above
min_GAdB and max_GAdB: specify the TX power Gain range scope only for entries of type 1.
type: 0 for fundamental frequency correction entries
1 for fundamental frequency additional correction within the TX power range specified by min_GAdB and max_GAdB columns
2 for third harmonic frequency correction entries (used by the NF/G analyzer only)
port: 0 for all the entries, except for devices that have multiple channels, like Pluto rev C/D, in this case, 0 means all ports, 1 only for the first channel ports, and 2 only for the second channel ports
How to write a correction table
Creating a correction table requires a lot of dedication and time, and last but not least, some needed tools to complete this task are not always available in our labs.
Normally you don’t need to create a table from scratch, because these are already included in the distribution for all supported devices, rather it’s about customization. However, it can be useful to see how to create a new table to understand the use of all the table fields.
Prerequisites
- A reliable supported device like an ADALM-PLUTO can speed up the operations.
- A calibrated synthetized generator with a sweeper option
- A calibrated power meter or a calibrated Spectrum Analyzer
If the table to be created is for a device that has a frequency range that falls partly within that of an ADALM-PLUTO then it is best to use an ADALM-PLUTO primarily as a reference instrument and use a synthetized generator with a sweeper option, a Power Meter and a Spectrum Analyzer for the remaining frequency range not covered.
An example of table creation from scratch
We want to create an RX compensation table for the RTL-SDR V4 device.
Generally, The first step is to write the RX side’s fundamental type entries (type 0). These entries will describe the device’s behavior in its fundamental frequency range. E.g., for AD936x-based devices it is from about 55 MHz to about 6 GHz, for R82x-based devices, like the RTL-SDR V4 with the up-converter option, it is from about 500 kHz to about 28 MHz for the HF range, and from about 28 MHz to about 1700 MHz for the VHF/UHF range. The next step should be to write the RX side’s harmonic type entries (type 2,3,12 and 13), but now only the fundamental type entries are needed for the RTL-SDR V4 device.
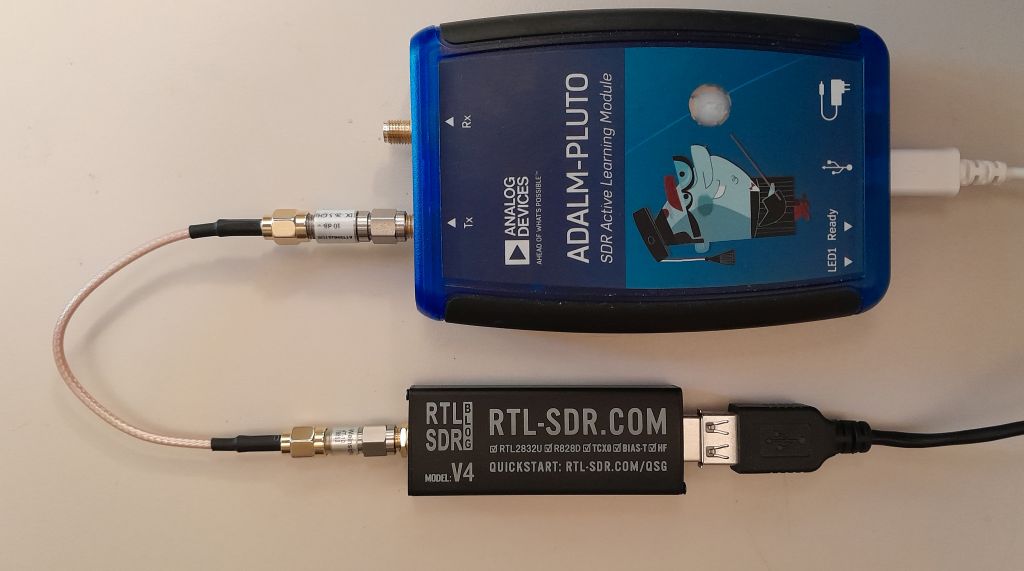
Connect an ADALM-PLUTO to an RTL-SDR V4 device with a loopback cable and two 10 dB attenuators, so the Pluto acts as a TX reference appliance.
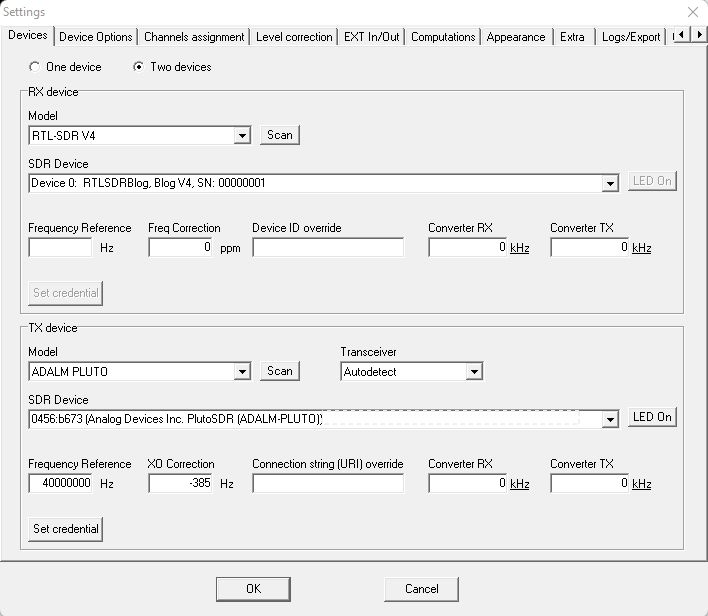
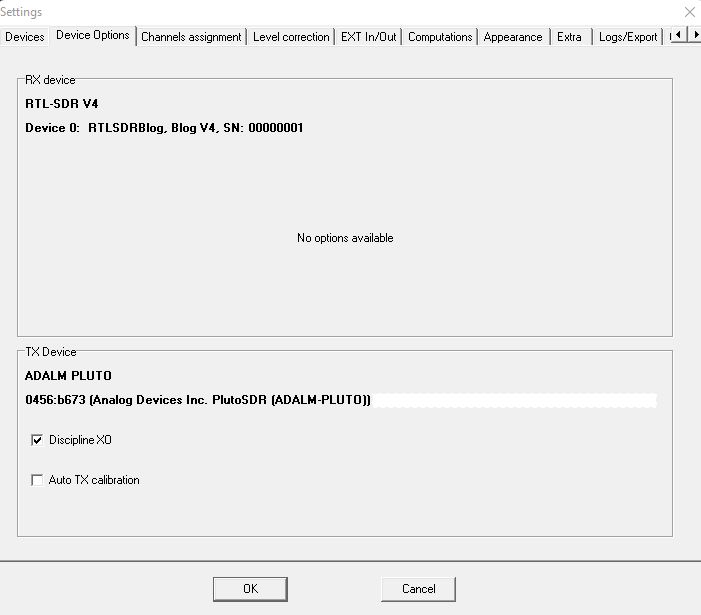
Setup SATSAGEN as follows:
Power On SATSAGEN and start the Spectrum Analyzer w/Tracking with the following setup:
Wait about 10 minutes to let the devices enter at a steady temperature and the discipline XO function syncs well the TX frequency to the RX device frequency.
The resultant trace should be the device RX curve characterization with a -30 dB offset.
You could copy the result as a new RX compensation table by subtracting the -30 dB offset constant from the values and you would be done.
SATSAGEN includes a feature that aids us in this task to reduce the manual drastically, the following chapter explains how to export the last completed TSA scan to a Correction Table:
Export the last completed TSA scan to a Correction Table
SATSAGEN version 0.9.1.0 includes a feature that exports the TSA scan result to a correction table.
This feature can be used when at least one scan is completed and available.
To start the export use the menu item File->Export->Export last completed TSA scan to the RX (or TX) Correction Table.
If you export to the RX correction table, it is assumed that the device under test is the RX and the TX device used in the scan is the reference. The data will be saved in the INI file defined as File INI RX correction in Settings, Level correction tab.
If you export to the TX correction table it is assumed that the device under test is the TX, then the data will be saved in the INI file defined as File INI TX correction.
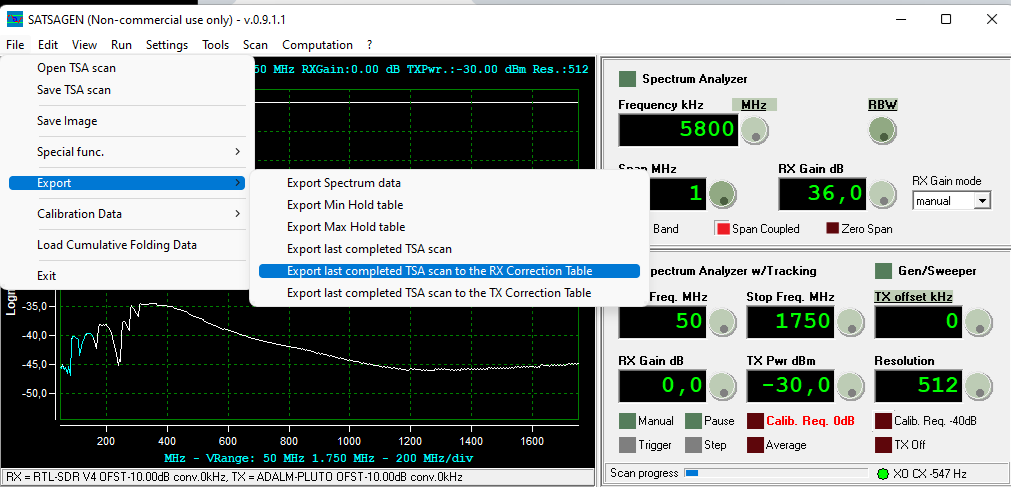
To complete the work started in the previous chapter, we choose the Export last completed TSA scan to the RX Correction Table option. The following dialog box will open:
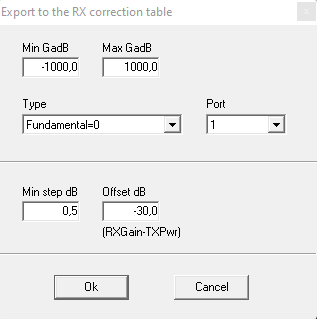
The top part of the dialog contains the Min GadB, Max GadB, Type, and Port target fields. We can leave these fields unchanged to create the compensation table for the fundamental type entries for the RTL-SDR v4 device.
The lower part of the dialog contains the Min step dB and Offset dB fields. The Min step dB field allows you to define the minimum step in dB for creating a new entry in the destination table to significantly reduce the number of entries created compared to the definition of the source scan. The Offset dB field is automatically calculated by subtracting the RX Gain value from the TX Pwr value.
Then, keeping the fields in the dialog box unchanged and clicking on OK, SATSAGEN will sequentially read the result of the 512 scan points and create as many entries in the RX correction table with the characteristics defined in the upper part of the window, subtracting the Offset dB from the values and verifying that at least one Offset dB step is respected between one entry and another.
The destination table must be empty for the fields defined in the upper part of the dialog, otherwise the export function stops and displays an error. This check is performed to protect against the corruption of existing tables.
Once the export and creation of the RX compensation table are complete, the following confirmation message will be displayed.
We still have to create entries in the RX compensation table for the remaining frequency range from 0 to 50 MHz not covered by the ADALM-PLUTO reference device just used.
How to create a RX correction table using an external sweep generator
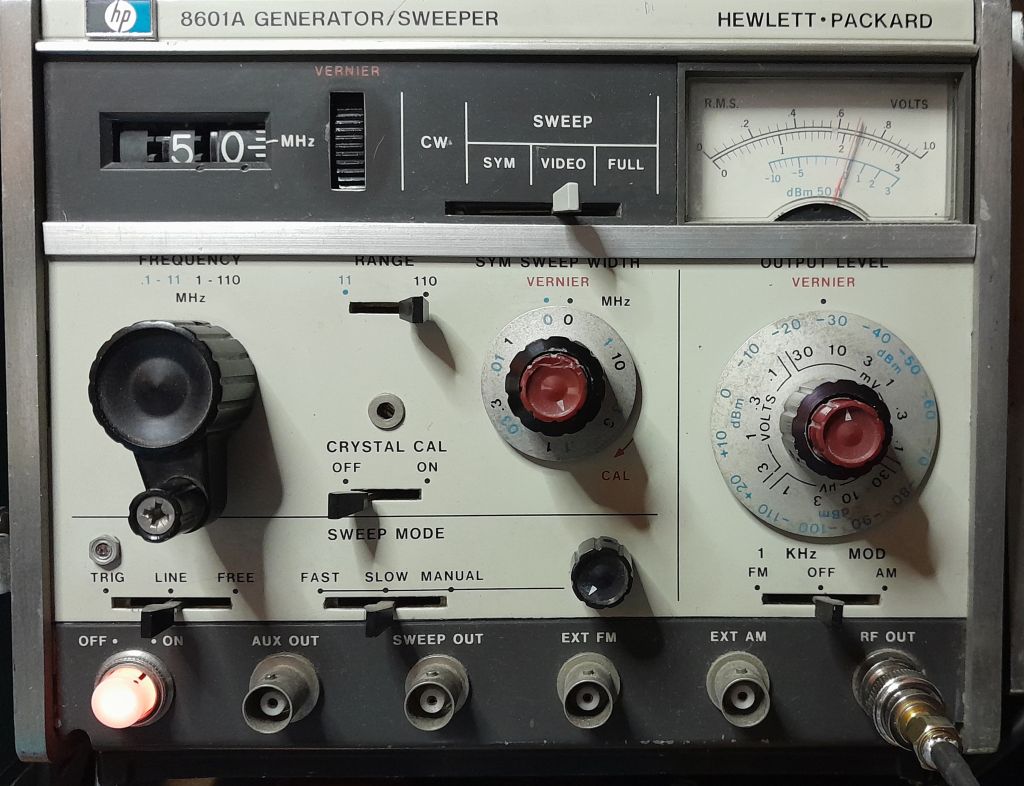
To continue the previous work of characterizing the RTL-SDR V4 device we now need to configure an external calibrated sweep generator.
Configure the sweep generator to sweep slowly at about 1 MHz per second over the range of about 0 to 50 MHz, with an output of -30 dBm CW.
Connect the RTL-SDR V4 to the sweep generator keeping the 10 dB attenuator.
Leave the Satsagen configuration unchanged, as used in the previous paragraph.
Run the Spectrum Analyzer with the Max Hold checked with the following setup.
Let it run for a few minutes until the spectrum is sufficiently defined.
Zoom the spectrum to highlight the most level changes and note them.
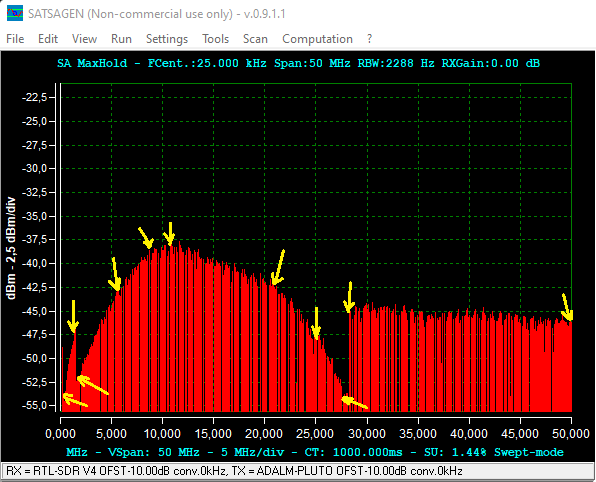
You should get a list similar to this:
| 0 MHz | -53.40 dBm |
| 1,5 MHz | -46,90 dBm |
| 1,6 MHz | -51,90 dBm |
| 6 MHz | -42,60 dBm |
| 9,3 MHz | -38,50 dBm |
| 11,6 MHz | -37,80 dBm |
| 21 MHz | -42,40 dBm |
| 25 MHz | -47,50 dBm |
| 27,8 MHz | -53,90 dBm |
| 28,2 MHz | -44,50 dBm |
| 50 MHz | -46,20 dBm |
- Make a backup copy of the curvecorrRX_PLUTOCGT.ini file in documents\satsagen\settings
- Go to Settings, Level correction tab, and open the INI Edit Tool
- Close the Settings window leaving the INI Edit Tool window open
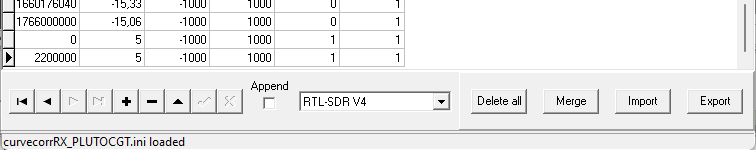
- Import the curvecorrRX_PLUTOCGT.ini file from the documents\satsagen\settings directory with the INI Edit Tool
- Select the RTL-SDR V4 device from the device model list
- Insert the above entries at the top of the table, decreasing the dBm levels of the -30 dB offset.
- Export to the curvecorrRX_PLUTOCGT.ini file confirming the overwrite
A further tuning
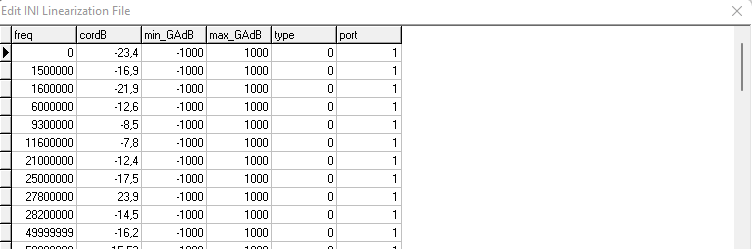
One odd behavior I noticed in the RTL-SDR V4 device, which may not be visible in a scan like the one used above, is a reading increase of about 5 dB when the Spectrum Analyzer center frequency is set up from about 500 kHz to exactly 2200 kHz.
A couple of type 1 entries illustrated in the chapter Deep on the RX/TX correction table fields added at the end table can be used to correct this problem:
A TX linearization table creation from scratch
To create a TX linearization table of a supported device in SATSAGEN, proceed exactly in the same way as illustrated in the previous example, where the compensation table for the RTL-SDR V4 device was created, with the only difference that the devices must be inverted!
So, for the frequency range covered by ADALM-PLUTO, this will be configured as an RX device in the Devices tab in Settings, and the device under test as a TX device. The export to the TX correction table will be performed at the end of the scanning procedure
For the range not covered by ADALM-PLUTO, the SATSAGEN Generator/Sweeper is configured to perform a scan in the required range and an external calibrated Spectrum Analyzer is connected to the TX device to obtain the Max Hold curve to be manually written in the TX correction INI file using the INI Edit tool.
Notes on the correction tables compiling
The Satsagen application reads the tables sequentially from the first record to the last. The application does not run an entry sort. The by-frequency field entry sorting task, from the min device frequency to the max device frequency is left to the user. In addition, the user should pay attention to the group by fields: the entries must be grouped by the port field, type field, and the min_GAdB and max_GAdB range.
The following image is an example that includes a set of entries correctly sorted and grouped by: